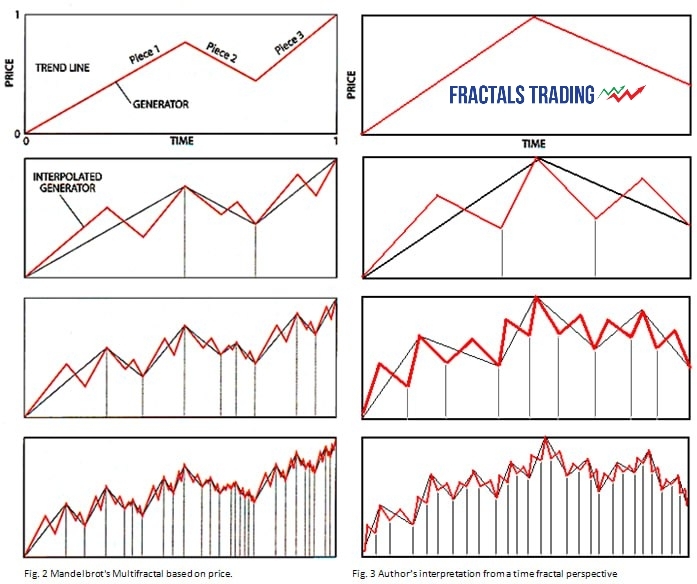
In this post, I’ll discuss a relatively new branch of mathematics called fractal geometry, and its potential applications to stock market models.
Though the name fractal geometry might initially sound intimidating, the logic behind it is surprisingly simple, and you don’t need a PhD in Math in order to understand how it could be of use for those interested in modeling the stock market.
Fractal Geometry is a naturally occurring phenomenon that involves a repeating pattern at every scale. For example, think of a tree: the trunk splits into branches, which in turn split into smaller branches, which in turn split into even smaller branches, and so on. Each “stage” illuminates a perfect model of the other stages, only at a different scale. The tree provides just one (hopefully) easy to understand illustration of thousands of naturally occurring examples of fractal geometry. From earthquakes to snow flakes, from coastlines to White Pines, fractal geometry seems to have permeated just about every level of nature.
“But Will,” you ask, “though interesting, how could this naturally occurring phenomenon possibly be useful for a young yuppie trying to make money in the stock market?” To understand the answer to this incredibly valid question, we must first consider the current stock market models, and their inherent problems. What follows is my attempt at describing the traditional models of the stock market, in what is sure to be a nearly criminal oversimplification that would make most financial analysts weep.
Traditional models involve calculating an expected return on a stock (profit), as well as finding the stock’s standard deviation (a measure of the stock’s riskiness). Portfolio managers combine many stocks together using this approach, diversifying in order to maximize profit and minimize risk.
