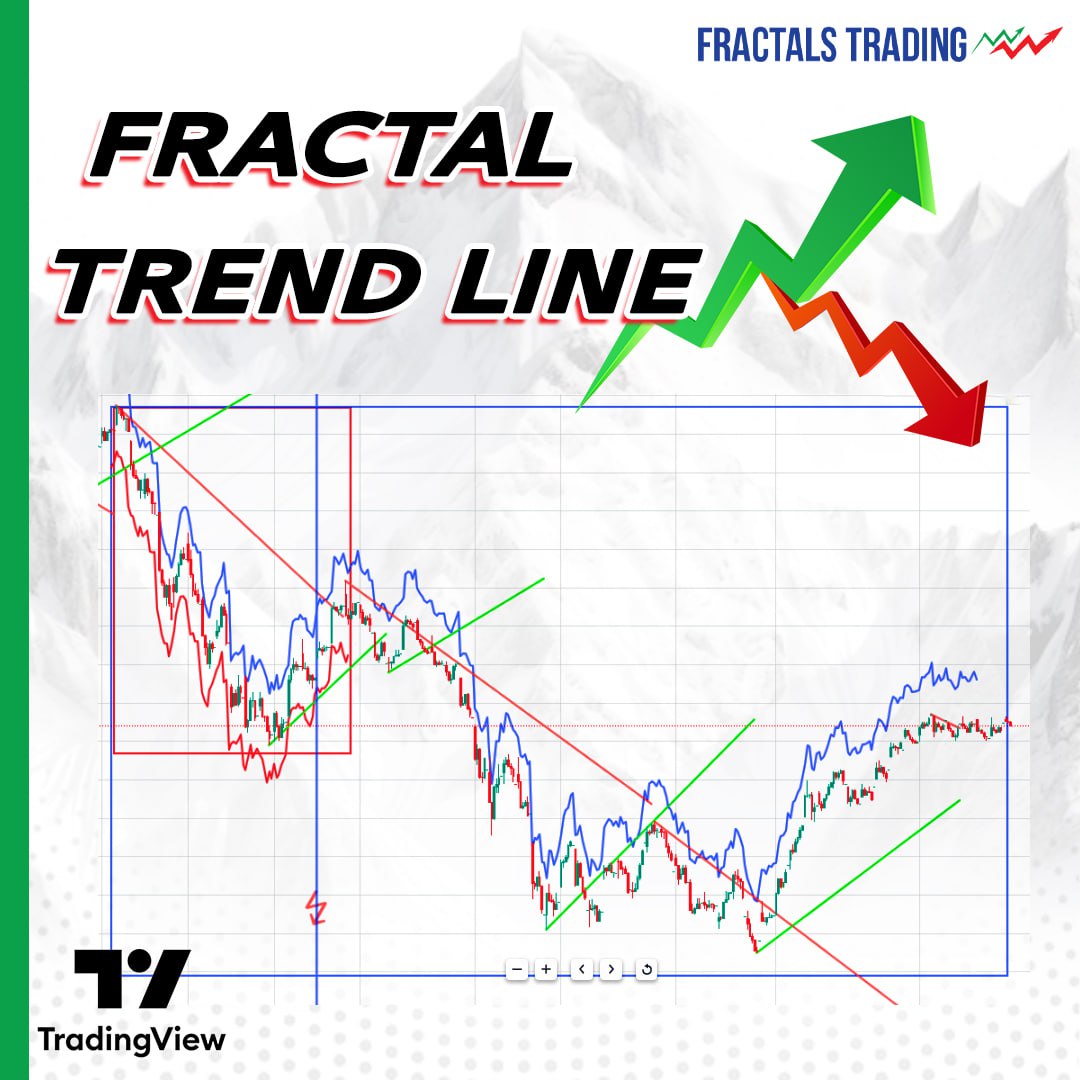
The Fractal Trend Line is an advanced indicator used on the TradingView platform for analyzing fractals on financial market charts. This indicator serves as a powerful tool for traders seeking a deeper understanding of price patterns and market dynamics.
It identifies and tracks key market peaks and troughs, drawing these points as solid lines on the chart. The indicator follows specific rules to determine when a new peak or trough is formed, aiding traders in pinpointing market reversals and analyzing trends with greater precision.
Fractal Trend Line stands out for its ability to customize the color and width of the lines, as well as the use of different time frames for analysis. Traders can use this indicator alone or in conjunction with other techniques such as Fibonacci levels, support and resistance, or other indicators to enhance their trading decisions.
As a tool in the technical trader’s toolkit, the indicator can help in identifying or confirming a trading direction profitably. Fractals are fundamental elements of trends—simple yet significant formations that recur across different time frames and are utilized by traders to determine or confirm market direction.
